Synopsis
North star
Reduce operational costs by making it easy to do business with Transamerica
Context: A business transformation initiative
As a large, longstanding financial services firm, Transamerica began an equally sizable business transformation effort in 2018.
Transamerica had grown through acquisition over a few decades, scooping up smaller insurance and investment firms and their digital experiences. This resulted in a high amount of operational overhead and a highly fragmented user experience for both financial professionals and their clients.
Tech stack: legacy backend, HTML/CSS, AngularJS, Sketch design system
Experience objective
Our directive was to consolidate over a dozen portals contributing to the fragmented portal experience by creating a single portal for insurance agents, financial advisors, and their clients.
The unified portal would modernize our digital platform, improving both business and user outcomes.
Value proposition
The new Advisor Experience will provide financial professionals with an all-in-one digital solution to manage their business with Transamerica.

Team players
My role
Product Design Manager + DesignOps Lead
When I joined Transamerica, the User Experience (UX) team comprised 18 members. Designers were organized into 3 pods, one for each operating unit. UX research was shared across all 3 pods.
As Product Design Manager, I managed and led the 3 designers responsible for supporting the Financial Professionals operating unit. My approach resulted in reduced operational costs, stronger cross-functional partnerships, and streamlined end-to-end design processes.
Involvement: people management, design ops, user research, information architecture
The team
- 3 Product Designers
- 1 UX Researcher
- 1 UX Producer
- 2 Product Owners
- 2 Scrum teams
Key results
- Onboarded 7,760 financial professionals within 3 months of launch and 139,912 new policyholder-users in the first calendar year
- Increased efficiency of analytics implementation by ~33% by partnering with UX Producer to involve analytics partners earlier
- Reduced reactivity and thrash by ~20% by starting biweekly PDE leadership meetings to anticipate and proactively solve problems
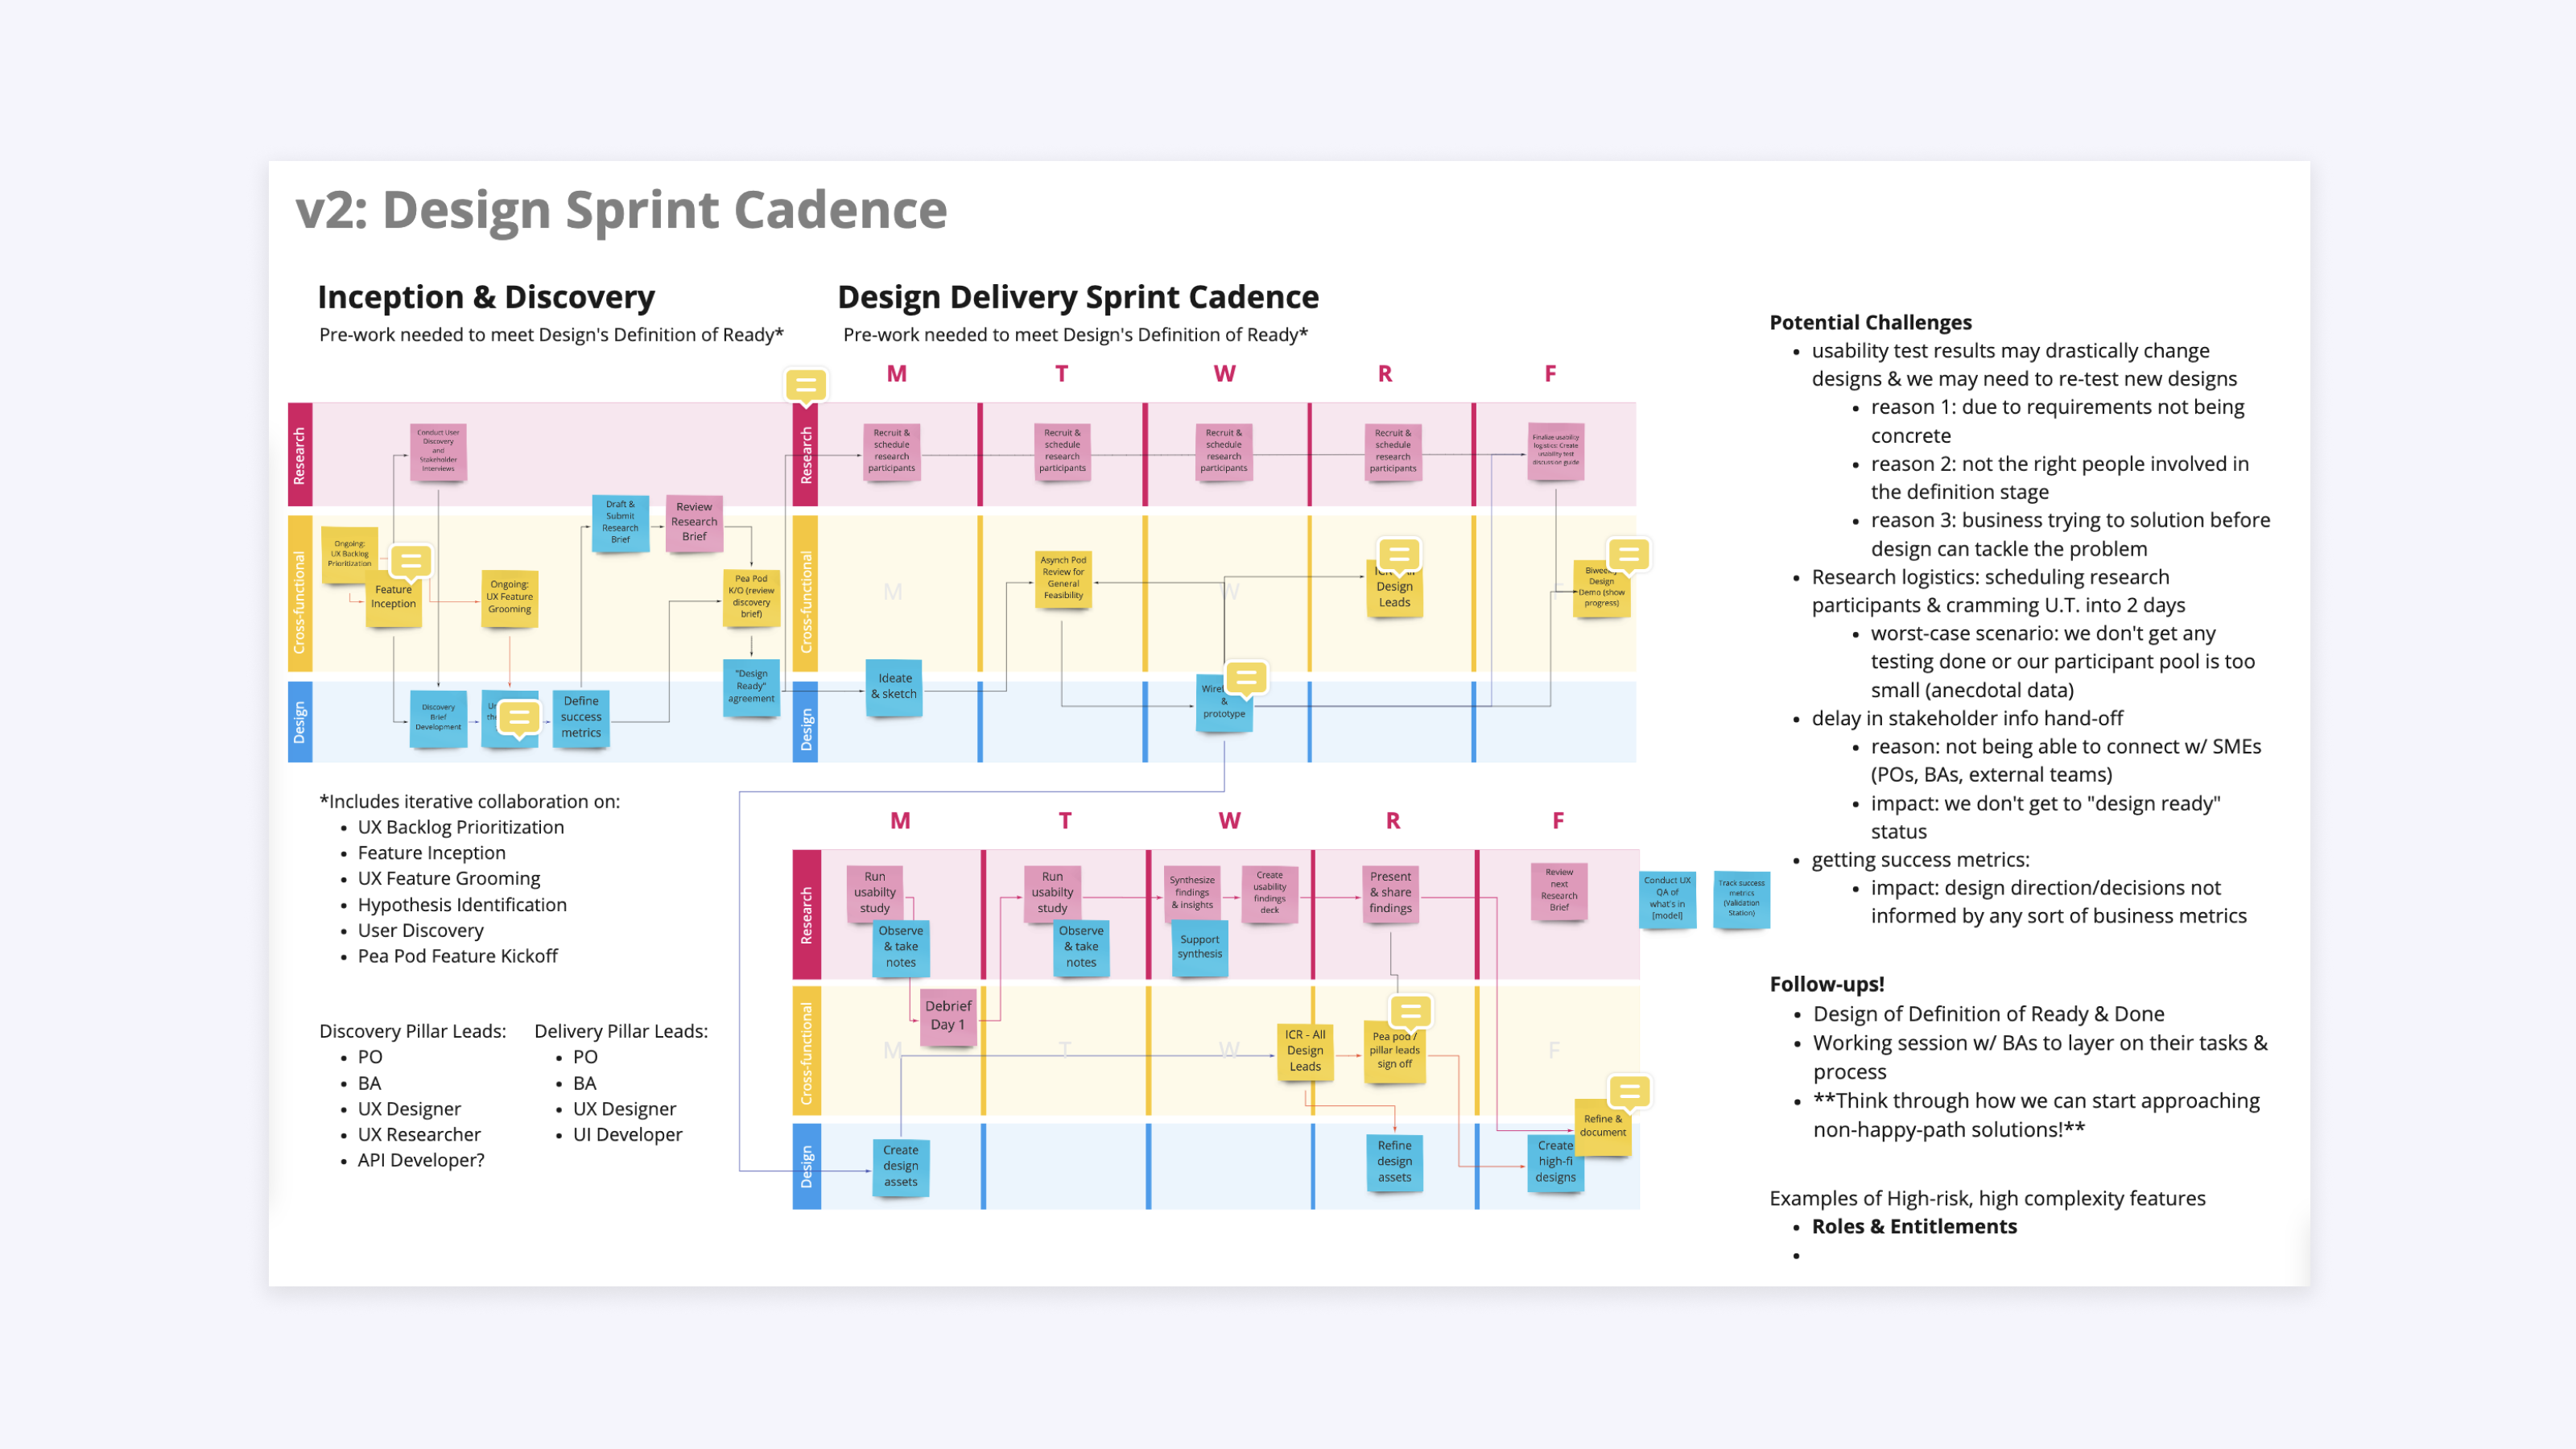
- Increased designer velocity by ~25% by increasing focus: launching design sprints, design intake brief, and design definition of ready
- Increased designer capacity by 10% by involving Legal and Compliance earlier in the product design process
The Journey
When I joined Transamerica in October 2019, the 2 Product Owners and scrum teams were under pressure to deliver the very first release of the Agent + Advisor portal. Tension was high, and there were several significant technical hurdles.
At this time, the 3 designers reporting to me had been operating with little oversight and inconsistent cross-functional collaboration.
Business drivers
- Increase revenue and reduce operational costs (time and attention that Sales and Support teams spend responding to FinPro needs, questions, and frustrations)
- Make it easier to do business with Transamerica by increasing self-service capabilities
- Improve Transamerica’s market reputation
- Sunset the legacy portals
Desired user outcomes
“As a Financial Professional, I want to…
- Easily manage my book of business in a single portal
- Spend less time on admin and more time building relationships with and selling to my clients
- Sell more Transamerica policies
Overcoming challenges and advancing UX maturity
Transamerica’s digital transformation effort posed 2 levels of challenges. The first level was the cross-cutting challenges that were common to all teams, and the second level was the design-specific challenges encountered by the UX team.
Cross-cutting challenges
All Transamerica technology teams across the business shared faced the same challenges:
- working within an immature SDLC and product function
- partnering with Product Owners who were strongly aligned to Sales and Operations objectives
- collaborating with primarily outsourced technology staff for the large, highly complex backend consolidation effort
Design-specific challenges
On top of this, the UX team encountered design-specific challenges:
- low UX maturity outside of the UX team
- strong confinement of scope to a “feature parity” mindset
- insufficient information provided to designers at the start of projects
Setting designers up for success
I took a multi-prong approach to ensure my design team would have sufficient information at the start of every project and reliable collaboration touchpoints with our 2 product owners.
Working arm-in-arm with my team’s digital producer, we set out to improve:
- Alignment on design decisions for the 2 experiences
- Collaboration with product and engineering partners
- Clarity of information required to confidently begin the design process
Building ongoing designer alignment
To ensure a smooth and cohesive experience, I scheduled regular standups and working sessions to support my designers’ alignment on
- factors that drove design decisions for both experiences
- actual design decisions and design patterns
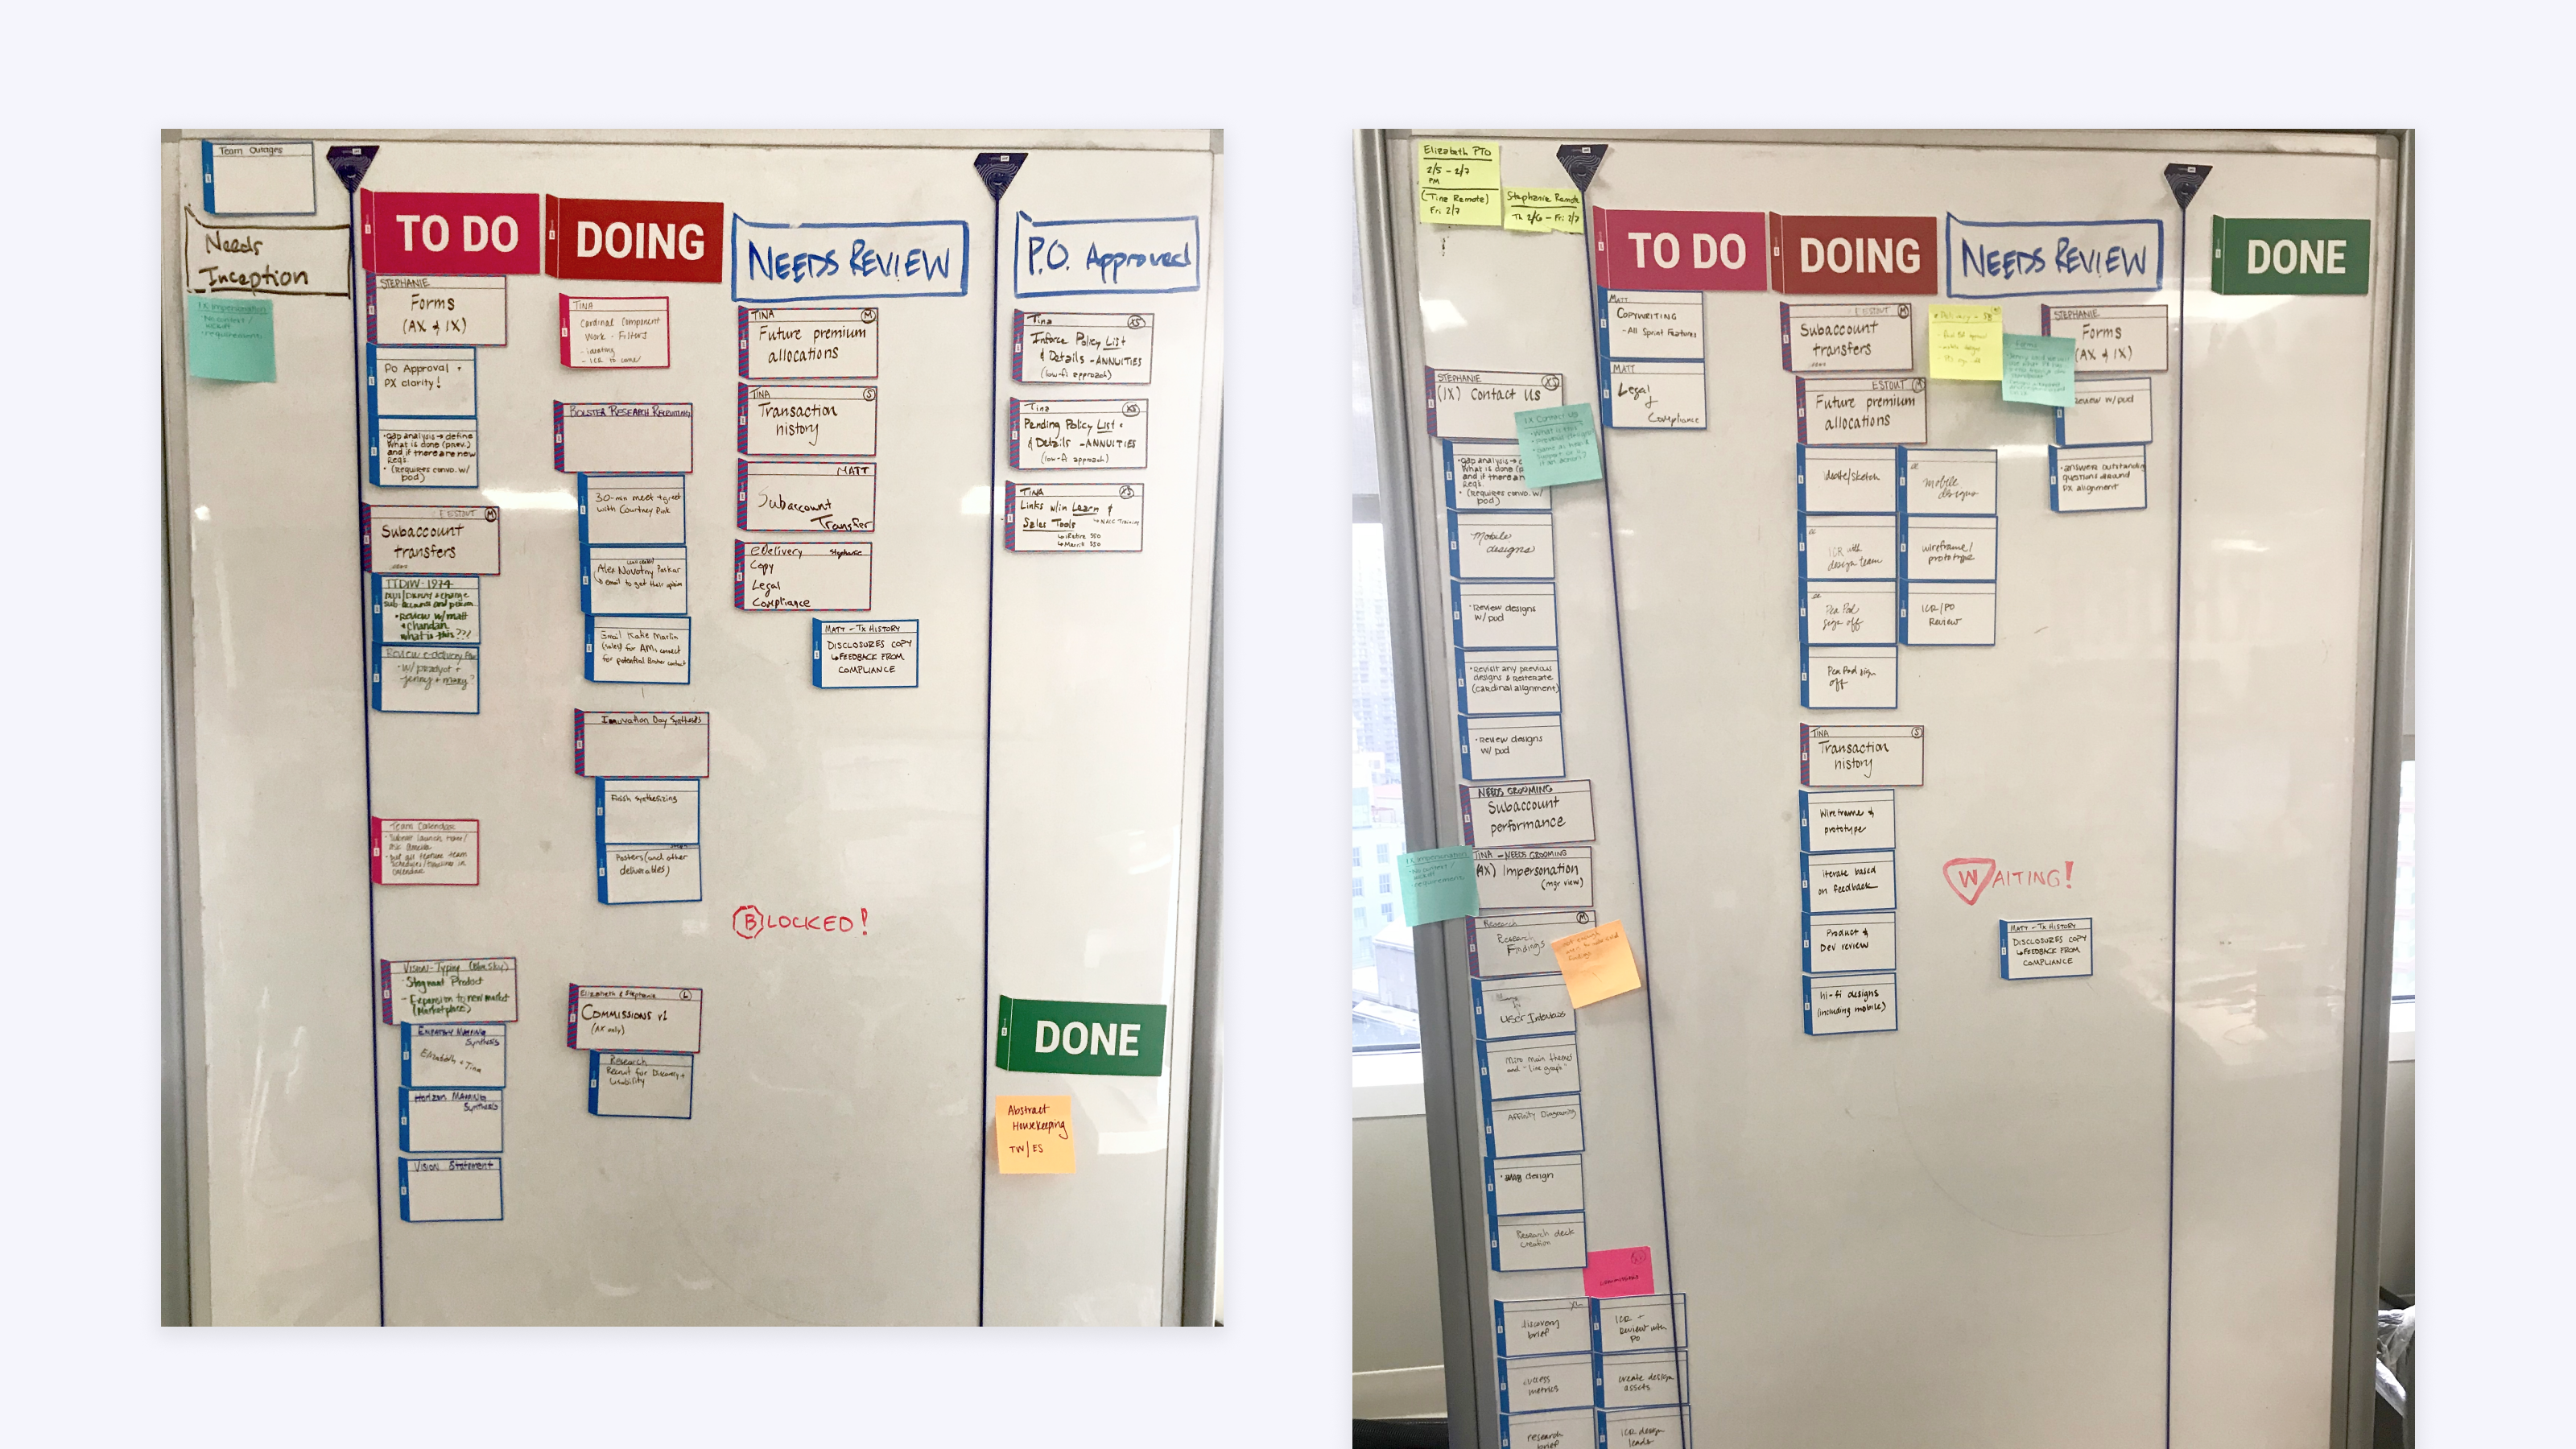
We also began running 2-week “scrumban”-style design sprints, and I acted as the Scrum Master for my design team.


Strengthening the UX-PO partnership
The biggest barrier to designer success was weak partnership with our 2 product owners (P.O.s). Like so many product people, they had full calendars, too much on their plates, and too many stakeholder cooks in their kitchen.
For us as a design team, it seemed that collaborating with UX was less of a priority. This was underscored by the fact that UX reported up through a very traditionally structured Marketing department. My design team consistently felt misunderstood and underappreciated.
In my role as product design manager, I first prioritized increasing transparency and alignment between my team and product and cross-functional partners. I achieved stronger product-UX partnerships in my first 3 months by initiating design-specific ceremonies that increased visibility and trust.
Experience principles and a common vocabulary
Later, I established a common vocabulary to guide designers’ conversations with Product Owners. I created the following matrix to facilitate discussions regarding how we would reduce operational costs with design.
| Business outcome | CX principle | Design principle |
|---|---|---|
| Drive adoption to reduce operational costs | Put FinPros first | Create client-centered workflows |
| Improve Transamerica’s market reputation | Make business easy, transparent, and reliable | Create frictionless servicing interactions |
| Improve Transamerica’s competitive advantage | Provide self-service tools | Provide personalized information and data-driven financial guidance |
Increasing information fidelity during intake
Although the relationships felt stronger, my design team was regularly tasked with work without clear business context or requirements.
The typical hand-off from our P.O.s took the form of a brief demo of the legacy experience and the guidance to redesign for “feature parity.”
As a design team, we knew that we needed to understand use cases and business operations to make informed design decisions. While the use cases were in part supplemented by UX research, the business context often came too late in the design process.
To address this problem, I collaborated with my digital producer to introduce and socialize an inception brief.
Introducing the inception brief
The inception brief served as a standard template that encompassed the information designers needed to confidently begin their design process. It also served to build a shared cross-functional understanding of the problem and desired outcomes for the shippable solution.
The inception brief encapsulated project vitals such as:
- Who is the target user?
- What is the problem that this feature set will solve?
- How big and complex is this effort?
- When is development targeted to start?
- Who are the key subject matter experts (SMEs) we should consult early in our design process?
It also included a Madlib-style template for a problem statement, as well as sections to define risks, dependencies, and success metrics for the business and for users.
To accompany the inception brief, I established a Design “Definition of Ready,” which quickly proved to improve the clarity of information designers received for new projects, including clarity of scope, priority, and design requirements.
Launch
The Agent + Advisor portal experience launched in Q1 of 2020, with the corresponding Individual (client) experience launching a few months later.
My team collaborated with Marketing to promote adoption by financial professionals with the following promotional reel (as well as other onboarding assets).
The new portal experience resulted in streamlined workflows for financial professionals and their clients, enabling clients to log in and see the same information as their advisor or agent.
Impact
DesignOps impact
- Increased efficiency of analytics implementation by ~33% by partnering with UX Producer to involve analytics partners earlier
- Reduced reactivity and thrash by ~20% by starting biweekly PDE leadership meetings to anticipate and proactively solve problems
- Increased designer velocity by ~25% by increasing focus: launching design sprints, design intake brief, and design definition of ready
- Increased designer capacity by 10% by involving Legal and Compliance earlier in the product design process
Product impact
User adoption: Financial Professionals
In the first 3 months, we onboarded 7,760 financial professional users to the Agent + Advisor experience.
They could now manage their book of business and service policies or investments in a single portal rather than multiple. This freed up time to focus on building and maintaining client relationships.
| Timeframe | Total Users | New Users | Metrics |
|---|---|---|---|
| first 3 months | 7,760 | 7,760 | +2586 new users/month (avg) |
| 2020 | 36,468 | 34,054 | +2838 new users/month (avg) |
| 2021 | 45,064 | 42,929 | +23.6% total users YoY |
User adoption: Policyholders
Within the first calendar year of launching the Individual (policyholder) experience, we onboarded 139,912 new users.
| Timeframe | Total Users | New Users | Metrics |
|---|---|---|---|
| 2020 | 0 | 0 | - |
| 2021 | 149,228 | 139,912 | +11,659 new users/month (avg) |
My leadership led to stronger cross-functional partnerships and a more modernized digital platform for Transamerica. The new portal enabled advisors, agents, and clients to more easily find and interact with policy and investment information.
In addition, the launch and subsequent releases facilitated the sunset of legacy portals.
Other achievements during my time at Transamerica include
- I pitched and guided team-led planning and facilitation of a vision workshop with product, engineering, and design leaders
- I created and pitched 3 information architecture concepts for advisor annuities view based on 11 jobs-to-be-done (JTBDs) identified during internal research with 5 sales partners; as a result, product partners chose one concept for further exploration

